How Machine Learning Can Make You Rich as a Restaurant Owner
12/17/2025
Are you a restaurant owner?
Yes?
Great! This blog could change your life!
No?
Well then, just imagine you are for the rest of this blog.
What would the value of an application be which, when you enter:
- A date
- The weather on that day
It would give you an accurate prediction of the amount of money you could expect to make that day?
Think about it, you could:
- Plan staffing — making sure not to understaff or overstaff
- Plan how much food to prepare
- Plan when to order supplies
With such an application, there would be a real prospect to cut a lot of waste, right?

All the talk about machine learning and AI in recent years has been about ChatGPT and other Large Language Models, but there is still huge power in more traditional use cases like this.
In this blog, I will go over how machine learning can be leveraged by restaurants, with a simple example, so that they can boost efficiency.
I aim to be as non-technical as possible, so that absolutely anyone can understand.
What do we want to build?
In the introduction, I mentioned an application that would predict the amount of food you would sell for a given date and weather.
Since we would be using machine learning to build it, the actual term for something like this would be a “model”.
Model → A program that can learn data by finding patterns and make decisions from this learned data
Let’s map this to the model we want to build:
Data
What is data? It is literally any information that could help us make the prediction, i.e., how much food we will sell on a given date. For our case, this information could be: amount of customers that come in, quantity of food sold, weather on different days. To make better predictions, having more data over the course of multiple years would help immensely.
Learn data by finding patterns
In this blog, we will discuss how we can get our model to do this. What do I mean by patterns, however? You can think of them as things that happen consistently in the data. For example, we may find that on Fridays, when the weather is good, we always sell the most amount of food.
Making a decision
Again, we will discuss in this blog how we make a decision. In the model we’re trying to build, it’s not really a decision; it’s a prediction (the amount of food we will sell for a given day). The idea is, however, that we use the information we learned in the previous step to help us make this prediction.
Given this, to build our model, we have three things to do: gather data, learn from that data, and make a decision based on that data — so let’s do it.
Step 1 - Gathering Data
As mentioned, this is information that could help us make the prediction, such as the food we sold on a given date. Where do we get this information from? Well, if you’re a restaurant owner, you most likely keep details about daily revenue somewhere — most likely online.
Some restaurants may even take it a step further to collect data. For example, they may install sensors to track the number of people that enter the restaurant hour-to-hour — also known as “footfall”.
The key is to collect information that is useful to the prediction we want the model to make. For example, how much does information regarding the price of utensils used in restaurants affect the amount of food sold? Probably very little or not at all.
On the other hand, the amount of people that enter the restaurant would directly affect the amount of food we sold.
The more useful information/data we can gather, the better our prediction will be.
Step 2 - Learning/Finding Patterns
This is an extremely broad topic in machine learning. There are many different ways we can learn and find patterns — and it can get very advanced very quickly.
In order to keep things simple, I’ll give a high-level overview of one of the things we could do to help us here. It is called “regression”.
Regression in machine learning is when a model learns to predict a number (a continuous value) from input data — like predicting a house price from its size and location.
So, for our case, the number we want to predict is how much food we will sell on a given date.
Recall that in the previous step, I mentioned that restaurants track “footfall” — the amount of people that come into a restaurant. For our very simple example, we will use this. We will look through all our days, look at the footfall on those days, and see how much we made. We can then put this onto a graph, as shown below:
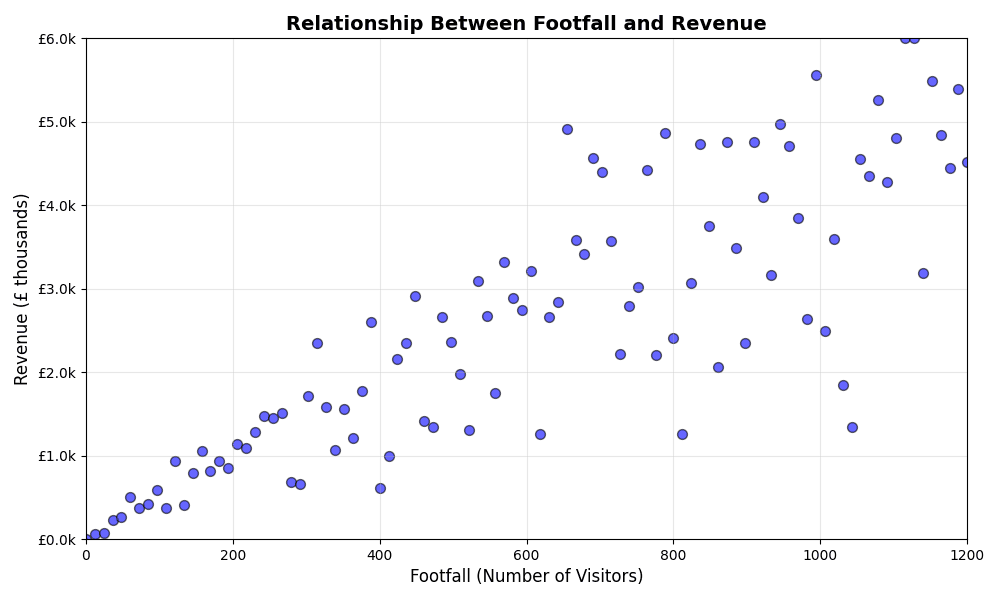
Just by looking at the graph, we can see an obvious trend here. The more people in the restaurant, the more food we sell — but we want to have an exact number for any given footfall. For example, this graph doesn’t tell us how much food we would sell if the footfall was 550.
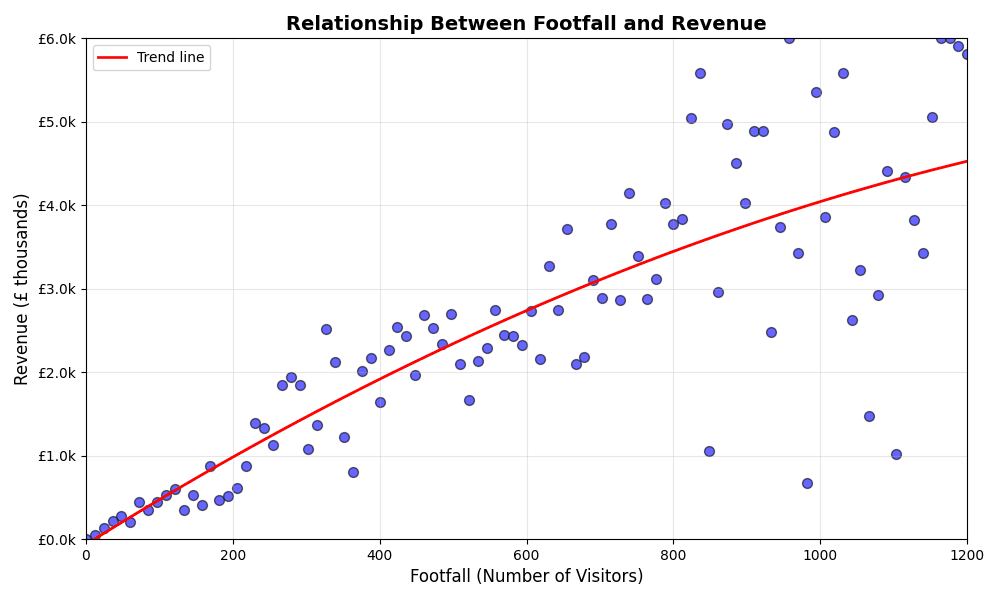
This is where our ML experts come in. They will use different algorithms to try to find a line that gets closest to every single data point in the graph. Below is an example of a possible line they may draw:
Step 3 - Making Decisions/Predictions
With this line drawn, we can now figure out how much food we would sell for a given number of people that walk into the restaurant.
But that’s not what we wanted. We want to be able to give it a date and have it make a prediction based on that. So what do we do?
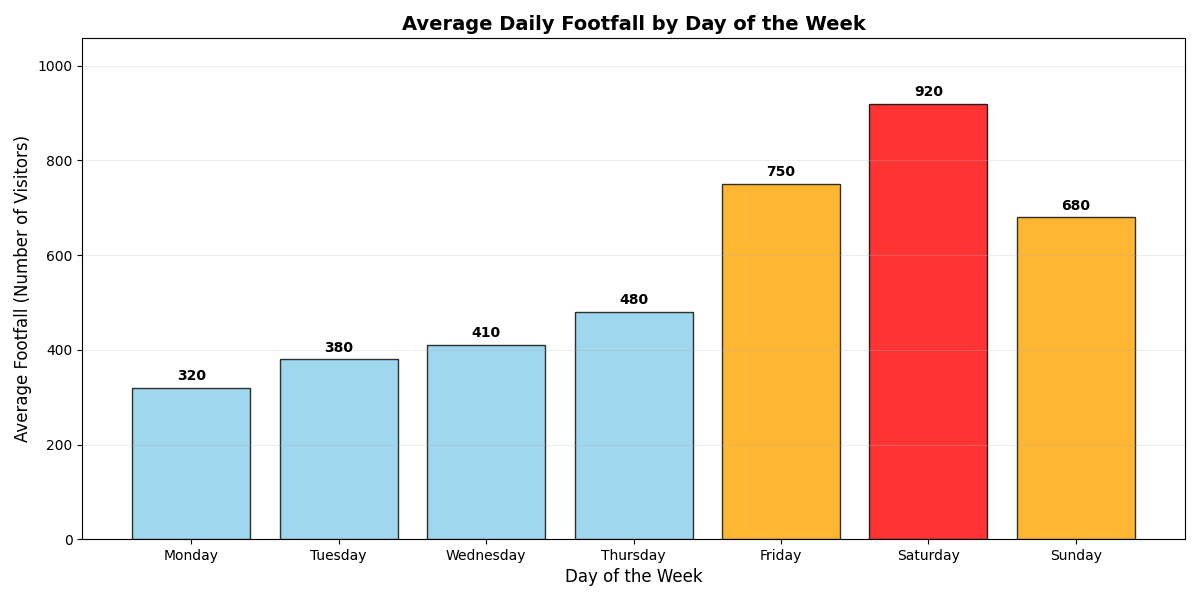
It’s quite simple. From step 1, we assume that we have the footfall for every date in the past however many months or years. What we can do with this is have the model work out the average footfall for each day of the week. For example, on Mondays there is an average footfall of 550; on Fridays it is 1,200.
The model can then go to the graph from step 2 and check how much food is sold for that number of footfalls.
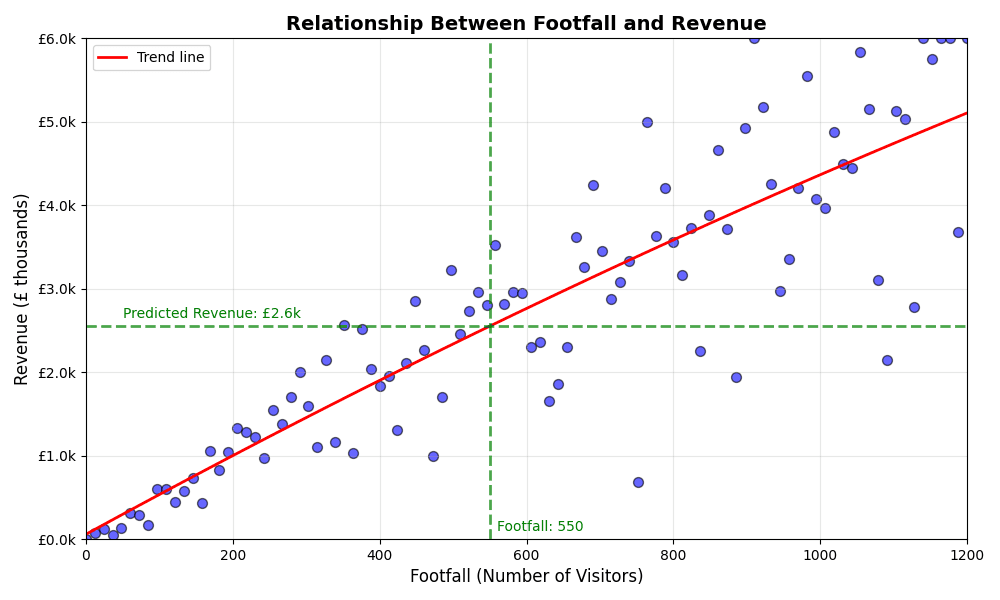
*In the image above we are predicting the revenue for a footfall of 550. This was not the average for any of the days of the week we found in the previous graph. This image is simply demonstrating how predictions are made.
So, putting it all together:
We input the date into the model
The model works out what day of the week it is based on the date
It then finds the average footfall for that day of the week
It then uses regression to work out how much food we will sell
Summary
In the beginning of the blog, I mentioned a model where we could enter the date AND the weather. To keep the explanation of how regression works as simple as possible, I opted not to include the weather part. But it is entirely possible to include this information as well and thus make better predictions. As I mentioned, more data usually means better predictions, but it’s best to leave this to the machine learning experts.
If you are interested in implementing a machine learning solution to improve your business, contact us at tekvasolutions@gmail.com.
You can also view our ‘Consultancy’ page for more information: https://www.tekva-solutions.com/consultancy